Sample Representation#
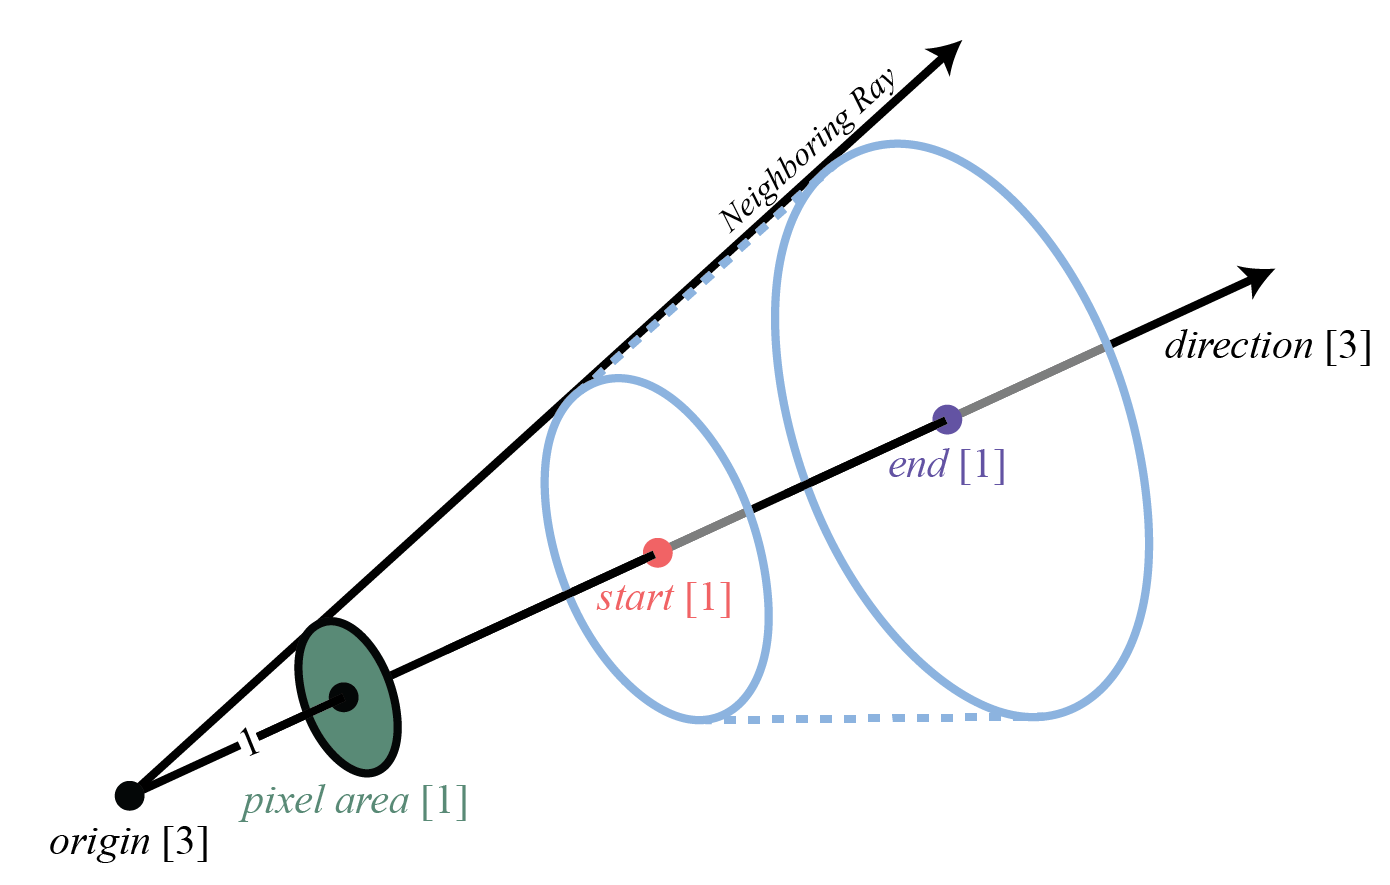
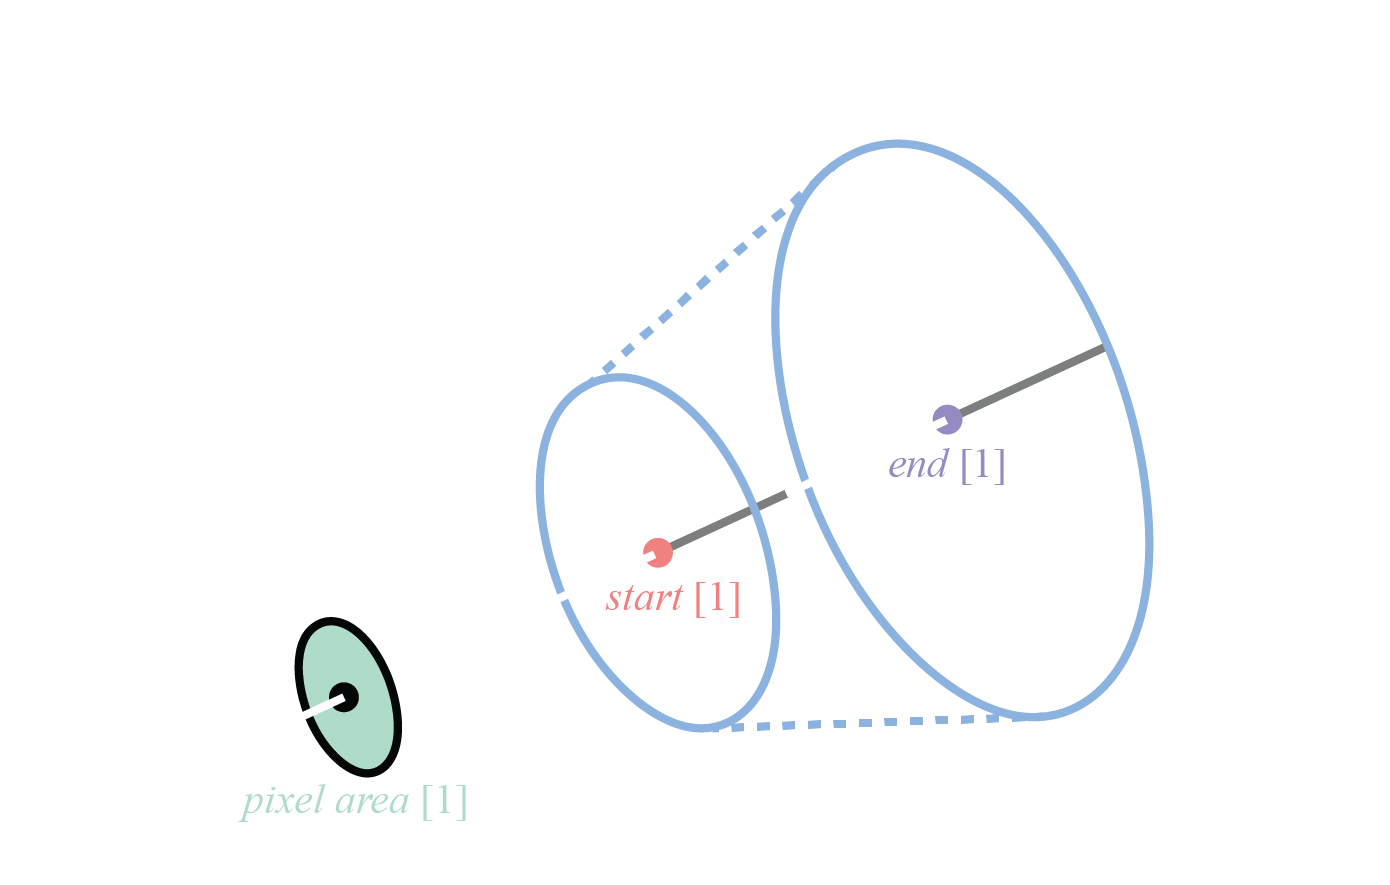
A core component of volumetric rendering is computing samples along a ray. The representation of these samples is important. We use conical frustums to represent samples. The conical frustums are defined via the following parameters:
Parameter |
Dimension |
Description |
|---|---|---|
origin |
3 |
The x,y,z origin of the ray |
direction |
3 |
The direction of the ray represented as a unit vector |
pixel area |
1 |
The pixel’s area a distance of 1 from the origin |
start |
1 |
The distance at which the frustum starts |
end |
1 |
The distance at which the frustums ends |
Note
Why conical frustums and not pyramidal frustums? Those interested in this question may be interested in A Pixel Is Not A Little Square by Alvy Ray Smith.
Important
This representation is only an approximation. nerfstudio calculates \(pixel area\) as \(dx * dy\) where \(dx\) and \(dy\) are the distance between points neighboring rays in the \(x\) and \(y\) direction a distance of 1 from the origin.
3D Frustum#
# COLLAPSED
import plotly.graph_objects as go
import torch
from nerfstudio.cameras.cameras import Cameras, CameraType
from nerfstudio.utils import plotly_utils as vis
cx = 2.0
cy = 2.0
fx = 10.0
fy = 10.0
num_samples = 3
near_plane = 1
far_plane = 3
c2w = torch.eye(4)[None, :3, :]
camera = Cameras(fx=fx, fy=fy, cx=cx, cy=cy, camera_to_worlds=c2w, camera_type=CameraType.PERSPECTIVE)
ray_bundle = camera.generate_rays(camera_indices=0)
bins = torch.linspace(near_plane, far_plane, num_samples + 1)[..., None]
ray_samples = ray_bundle.get_ray_samples(bin_starts=bins[:-1, :], bin_ends=bins[1:, :])
vis_rays = vis.get_ray_bundle_lines(ray_bundle, color="teal", length=far_plane)
fig = go.Figure(data=[vis_rays] + vis.get_frustums_mesh_list(ray_samples.frustums), layout=webdocs_layout)
fig.show()
Representing Frustums as Points#
These frustums can be converted into point samples using frustum.get_positions().
# COLLAPSED
fig = go.Figure(data=[vis_rays, vis.get_frustum_points(ray_samples.frustums)], layout=webdocs_layout)
fig.show()
Representing Frustums as Gaussians#
We can also appoximate the frustums using Gaussians with frustum.get_gaussian_blob().
# COLLAPSED
fig = go.Figure(
data=[vis_rays] + vis.get_gaussian_ellipsoids_list(ray_samples.frustums.flatten().get_gaussian_blob()),
layout=webdocs_layout,
)
fig.show()